


The team dashboard
What you'll learn
- How to read a team's dashboard
- How to filter by position and age
- What the ranking is for (and what it is not for)
- In the menu, tap Teams and choose the team and the window (as on the profile). To look at one period, pick it in Period, choose what to compare it with in Compare with and tap Apply: every section shows that period and the trend shows only the periods you picked. Clear filters brings back all of them.
- At the top are the period's figures: average total score, matches won, drawn and lost, evaluations completed, players with minutes and training attendance.
- Results by pillar: the "Yes" percentage of each pillar, with a line marking the previous period.
- Profile by position: one radar per position played. Trend: the team period by period, with its table.
- Biggest collective needs: the team's variables with the fewest "Yes" answers, to guide training.
- Ranking by total score, with each player's change.

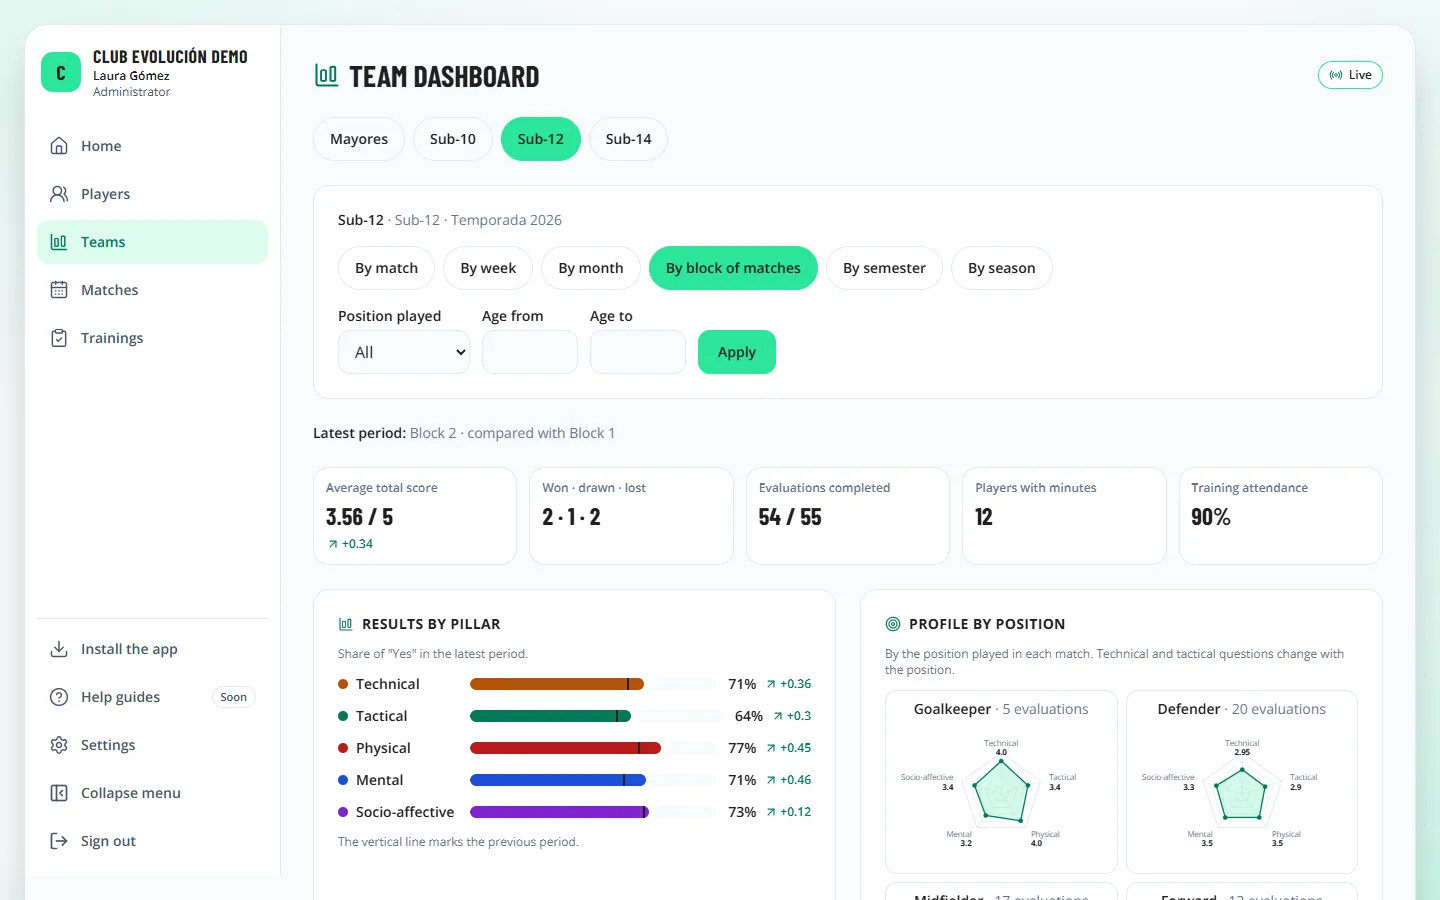
Use the position and age filters to look at only part of the team (for example, the defenders). *Age from / to* uses each player's age on the day of the match, in whole years, and includes both ends: 10 to 11 includes players aged 10 and 11. With fewer than 5 players, the period is marked as a small sample.
Important
The ranking is information for the coaching staff: it never decides call-ups, line-ups or minutes.
Depending on your role
A coach sees only their assigned teams.
Tip
To read each section of the dashboard in detail, with an example, see lessons 26 and 29 (*Read and understand your data*).
Recap
- Choose team and window; filter by position or age
- Pillars, positions, trend and collective needs
- The ranking informs, it does not decide
To unmark the lesson, select the button again.
Questions? Visit our support portal: support.proevolutionlab.com (opens in a new tab)