


Read a player's performance: tiles, radar and trend
What you'll learn
- What each pillar tile and the total score say
- How to read the five-pillar radar
- How to read the trend chart and the table
Open a player and scroll to Performance. We'll use a real example from the demo data: a Sub-12 goalkeeper, By match.
- Latest period — "Oct 14, 2026 · Escuela Andina · 1 evaluation · compared with Oct 7, 2026 · Deportivo Sur": the tiles show the Oct 14 match, compared with the Oct 7 match.
- Pillar tiles — *Technical 5.0 ↗ +1*: "Yes" to all 5 technical questions, one more than in the previous match. *Physical 3.0 ↘ −1*: 3 "Yes" out of 5, one fewer than before.
- Total score (the highlighted tile) — *4.2 ↗ +0.4*: the average of the five pillars (5 + 5 + 3 + 4 + 4 = 21 ÷ 5), up 0.4 on the previous match.
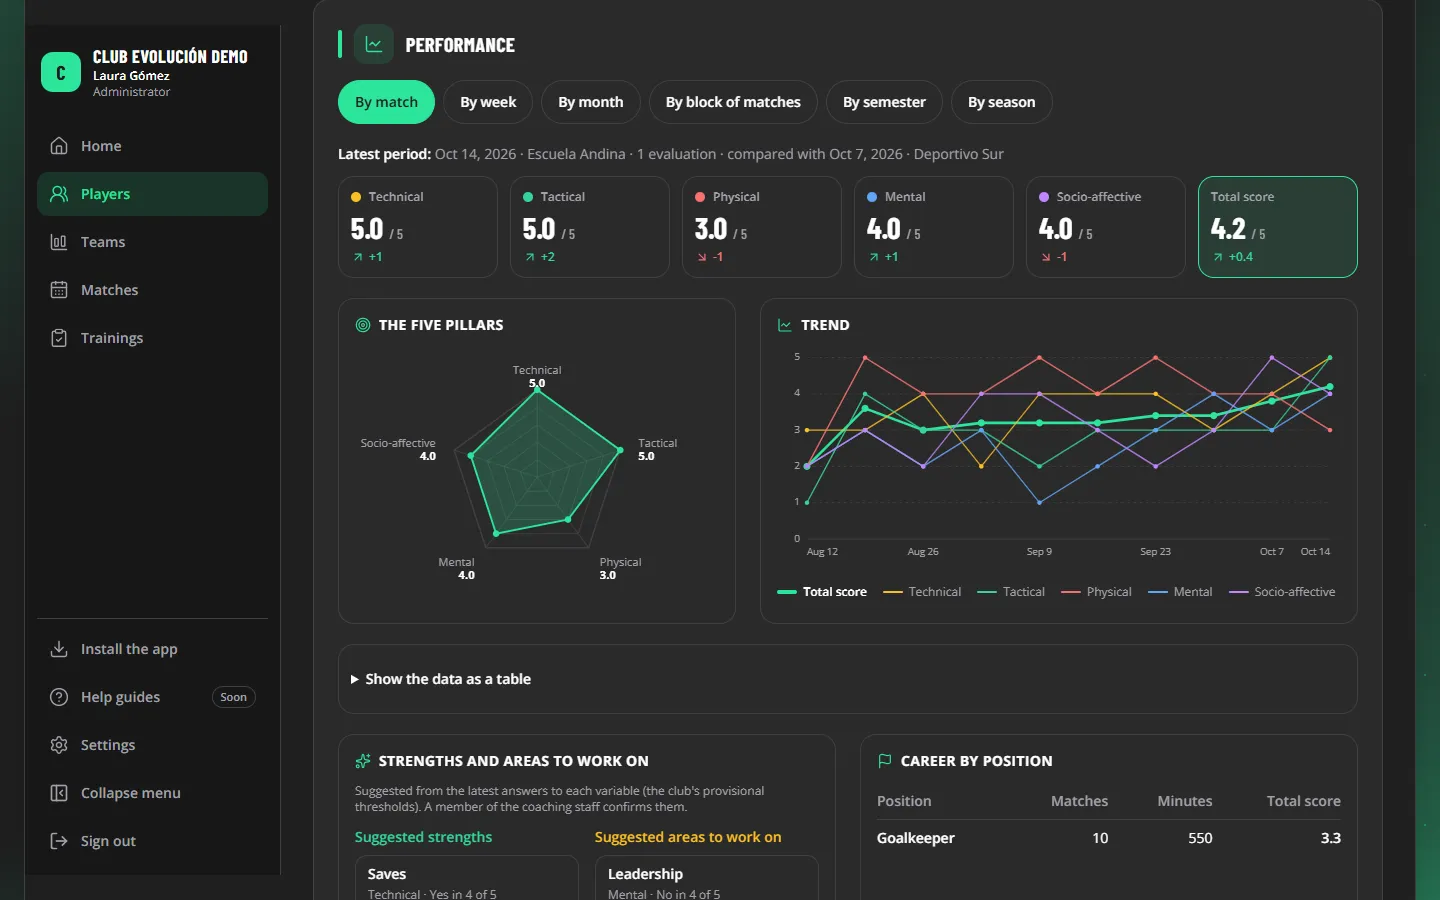
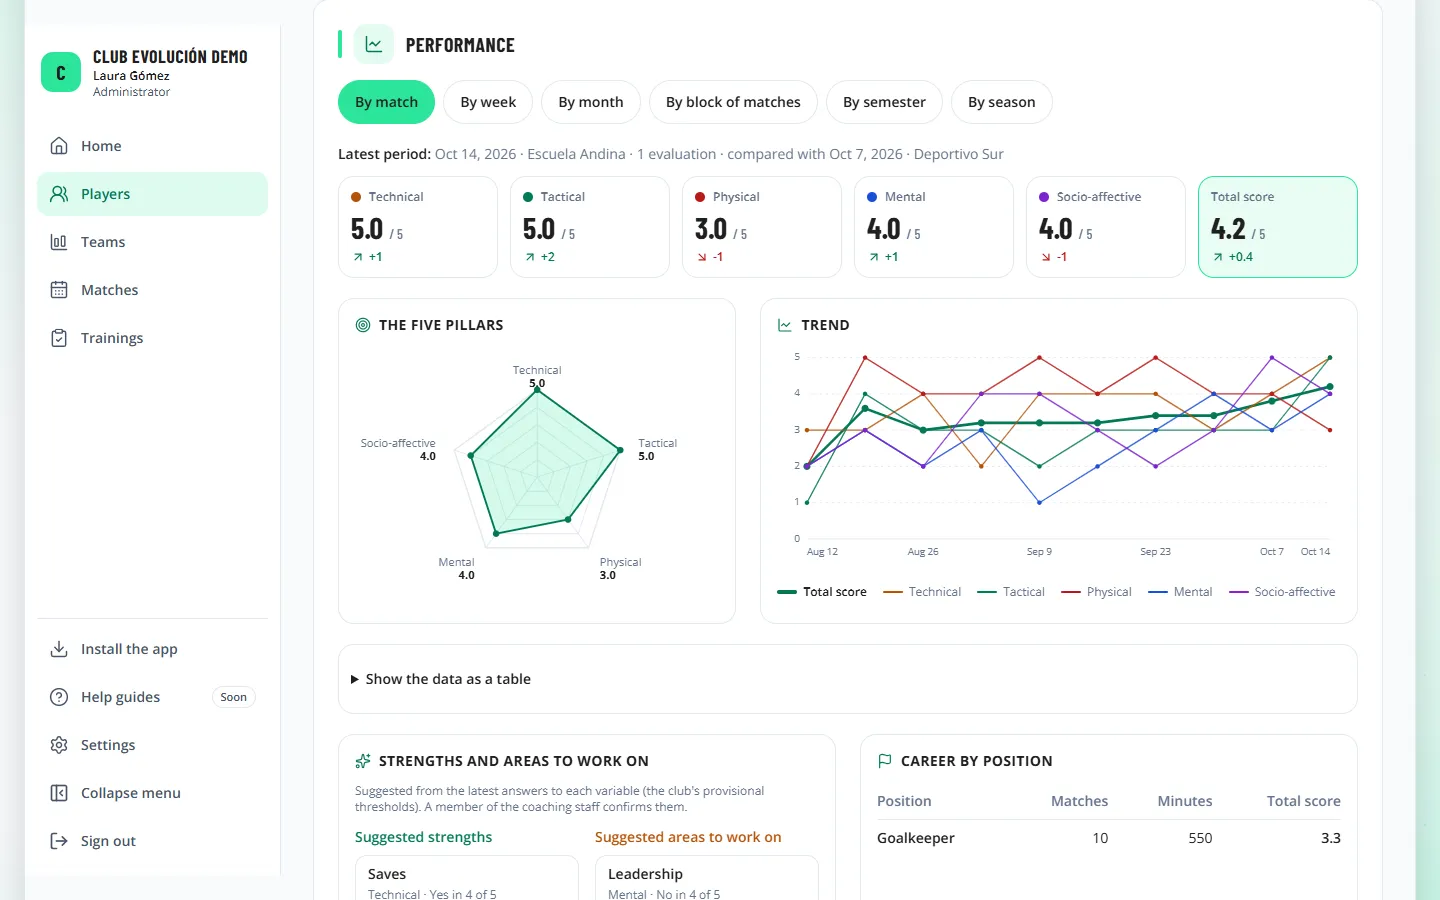
The radar (The five pillars) draws the five pillars at once. Each point is a pillar: the centre is 0 and the outer edge is 5.
- A large, even shape: a good level in every pillar.
- A shape with one point pulled in: that pillar needs the most work (in the example, *Physical 3.0*).
- The number next to each pillar is its score; you don't need to measure the drawing.
The trend shows how the scores change period by period:
- The horizontal axis is the periods (match dates, weeks, months or blocks, depending on the window); the vertical axis is the 0 to 5 scale.
- The thick green line is the total score; the thin coloured lines are the pillars (the legend underneath says which colour is which).
- Look at the direction of several points in a row, not a single point: a line that rises for 3 or 4 periods is a real improvement; an isolated spike may be one particular match.
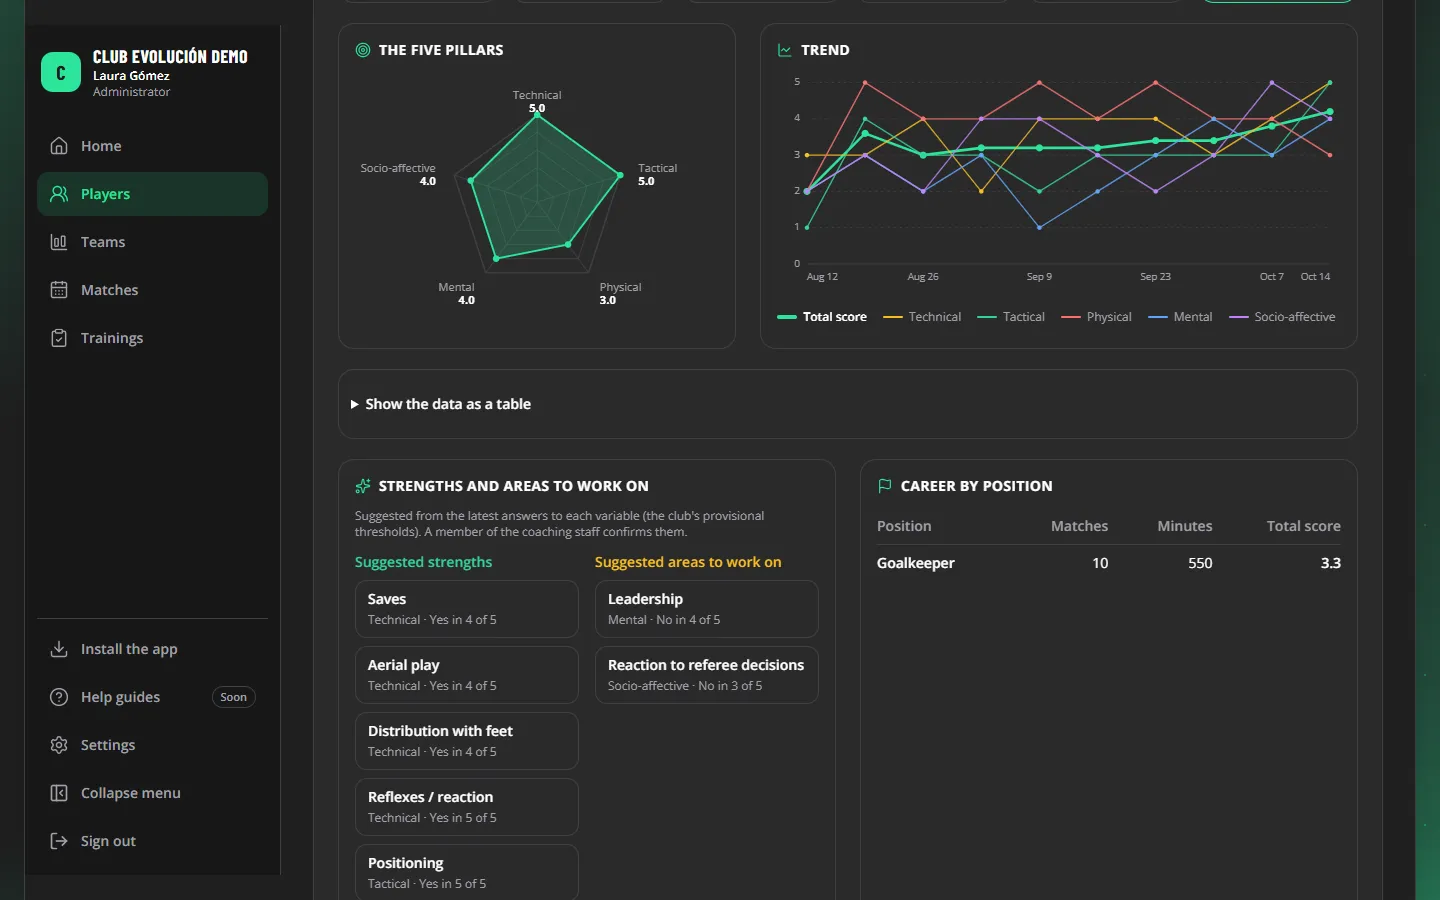
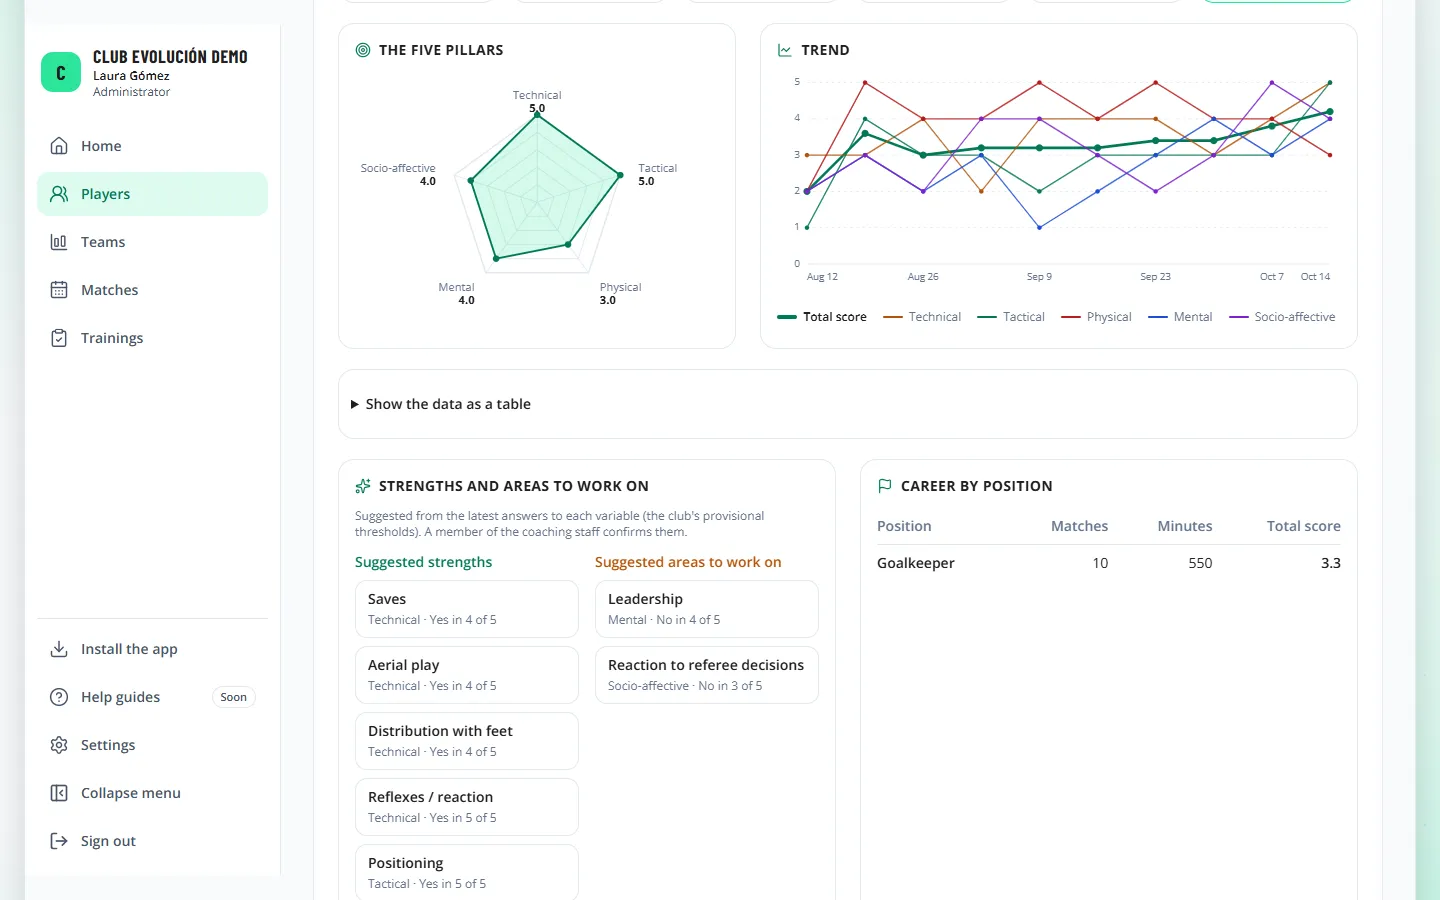
Show the data as a table opens the same numbers as the chart, period by period. Use it when you need the exact figure or when the lines cross a lot.
Tip
By match, the lines go up and down a lot because each point is a single match. Switch to By block of matches or By month to see the trend more clearly.
Recap
- Tiles: the latest period and its change against the previous one
- Radar: centre 0, edge 5; the point pulled in is what needs most work
- Trend: look at several points in a row; the table gives the exact numbers
To unmark the lesson, select the button again.
Questions? Visit our support portal: support.proevolutionlab.com (opens in a new tab)