


Player performance
What you'll learn
- How to choose the time window
- How to read the pillars, the radar and the trend
- What the suggested strengths and areas to work on are
Performance is the first section of the player profile.
- Choose the window: *By match*, *By week*, *By month*, *By block of matches* (5 of the team's matches in the season), *By semester* or *By season*. To see one period, pick it in Period and, in Compare with, the period you want to compare it with (or *No comparison*), then tap Apply: the cards, the radar and the trend show only what you picked. Show all brings back every period.
- Read the tiles of the latest period: the five pillars and the total score, each from 0 to 5, with the change against the previous period (▲ up, ▼ down).
- The radar shows the five pillars together; the Trend, how they change period by period. Below, Show the data as a table shows the same numbers.
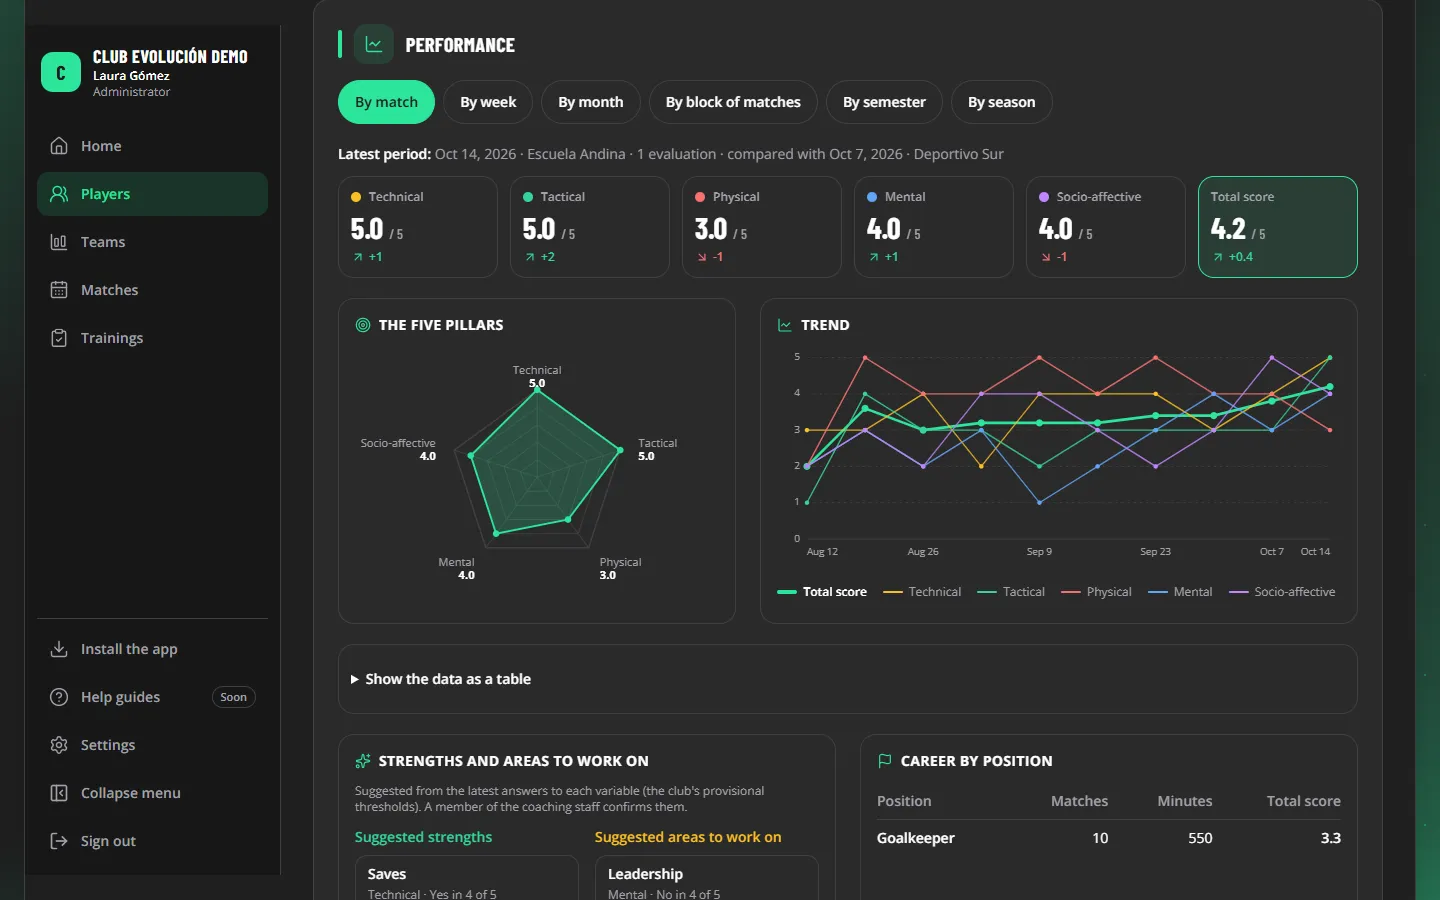
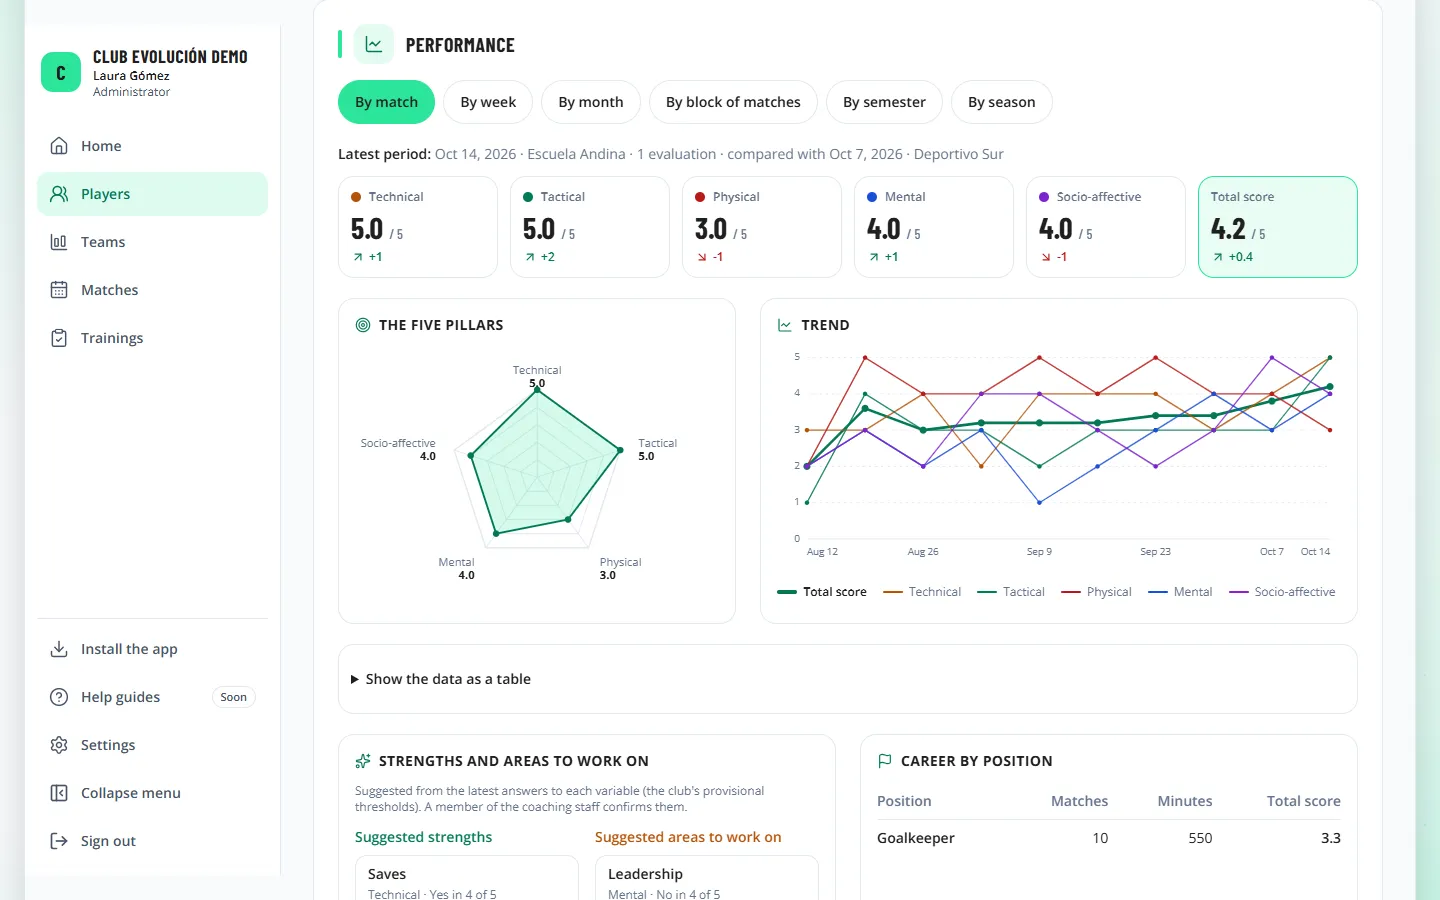
Further down:
- *Suggested* Strengths and areas to work on: the variables answered "Yes" (or "No") in most of their latest answers, using the club's provisional thresholds. They are a suggestion: a member of the coaching staff confirms them.
- Career by position: performance by the position played in each match (*Small sample* when there are few matches). The player's usual position does not change.
- Latest matches and attendance: minutes, goals, assists and score of each match, and the season's training attendance.
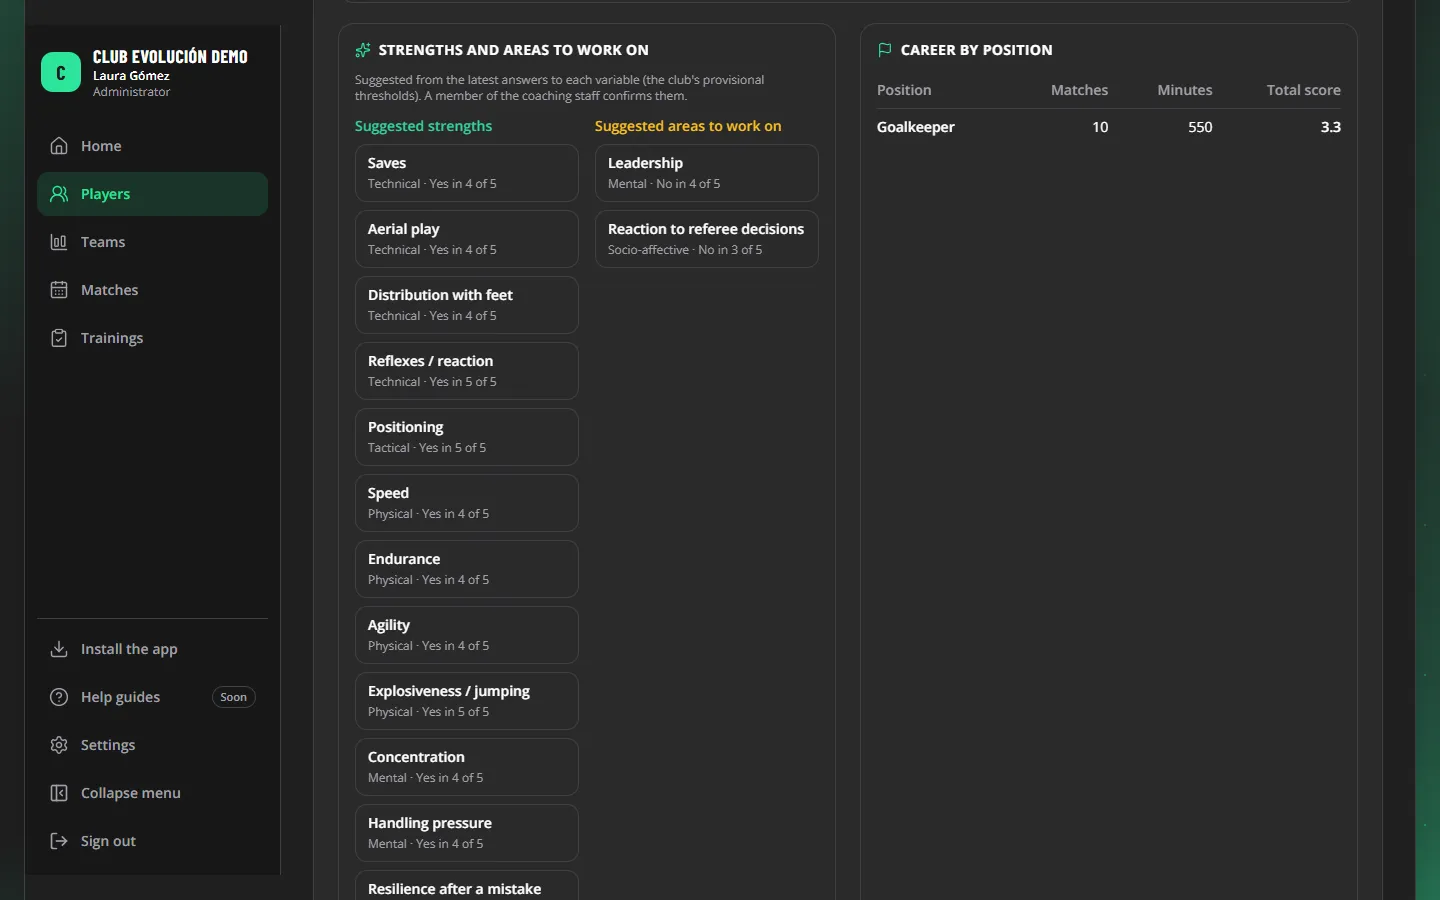
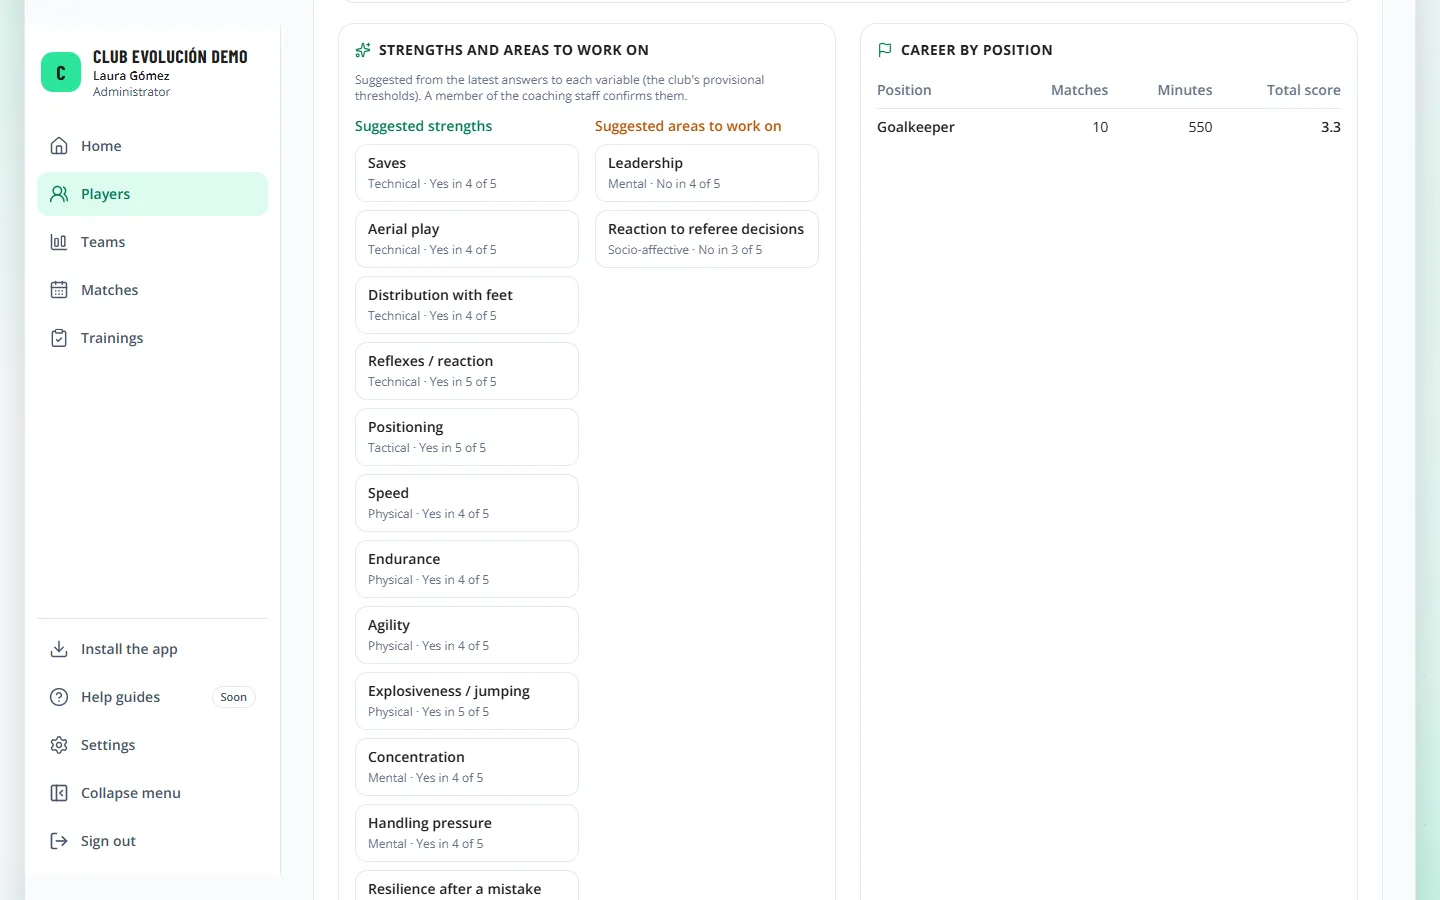
Tip
For a period, each pillar is 5 × (all "Yes" ÷ all answers). By match it is exactly that evaluation's score.
Tip
To read each tile, the radar and the trend in detail, with an example, see lessons 26 to 28 (*Read and understand your data*).
Recap
- The window changes the whole analysis
- Tiles, radar and trend, always with a table
- Strengths and areas to work on are suggestions a person confirms
To unmark the lesson, select the button again.
Questions? Visit our support portal: support.proevolutionlab.com (opens in a new tab)